Summary: Lattitude vs. X
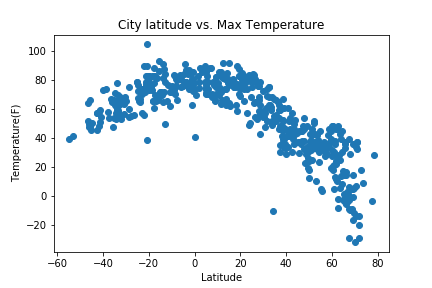
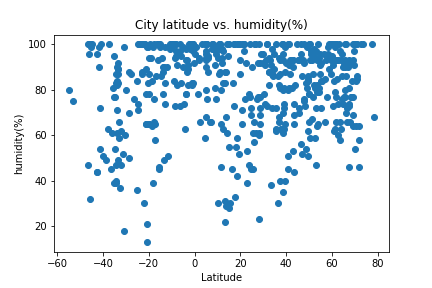
This project is to visualize a weather analysis results performed in a previous project Weather project, in which we studied the current weather all over the world. We are supposed to choose more than 500 cities with random latitude and longitude coordinates. Query the weather data from OpenWeatherMap API, make some plots and draw some conclusions about the dependence of weather on the latitude value.
Here we presented the results in a web visualization dashboard. This is a user-friendly way to access the results presented in Weather project. For further technique detailes, please go back to Weather project where we have python codes(jupyter notebook version) to attain the corresponding data for today.
.png)
.png)